Nagios is an open source IT Infrastructure monitoring system. It is mature, widely used, supported, flexible and extensible. Perhaps the industry standard.
Nagios at Home
I use Nagios on my LAN at home to monitor
- Remote virtual machines that host my
- personal blogs
- business sites
- Status of Raid arrays
- Linux
- Microsoft Server 2008r2
- Disk space availability on multiMedia server
- Asterisk PBX status for phone(s)
- Temperature at home
- indoors
- outdoors
- …
Here is my main ‘rack’ at home.

- NerdDoro
- ePhidgety – Phidgets, MySQL C++
- Server 2008R2
- Fedora fc.16 – LAMP stack
- CentOS Asterisk (retiring PBX)
- Wireless phone base station
- Grandstream HT502 ATA
- Monitor/Keyboard 4 way switch
- RaspBerryPi (new Asterisk PBX)
- UPS
- Future CNC project likes extra slot in monitor switch. Note NEMA stepper motors.
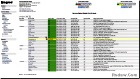
Display of Nagios monitored services including temperature from two separate sensors shown in this status screen. (click image to enlarge) The yellow highlighted line indicating warning, and the line above are temperature readings. The boxes to the left of each with the diagonal red line indicate not to send alerts.

Nagios provides me email updates like this one when my Asterisk PBX, pisterisk, went down.
Subject: ** PROBLEM Host Alert: pisterisk is DOWN **


***** Nagios *****

Notification Type: PROBLEM
Host: pisterisk
State: DOWN
Address: 192.168.1.220
Info: CRITICAL - Host Unreachable (192.168.1.220)

Date/Time: Mon Aug 19 11:01:12 MST 2013
And this email informing me that the problem is resolved, that pisterisk is back up:
Subject: ** RECOVERY Host Alert: pisterisk is UP **


***** Nagios *****

Notification Type: RECOVERY
Host: pisterisk
State: UP
Address: 192.168.1.220
Info: PING OK - Packet loss = 0%, RTA = 0.68 ms

Date/Time: Mon Aug 19 11:03:02 MST 2013
Nagios Thermometer
This article assumes you have a working Nagios system and have some familiarity with Nagios configuration. This blog post will explain how I monitor temperature with Nagios using a hardware sensor compatible with my HomeAmation MS Windows 8 and Windows Phone 8 projects.
Previously I’ve published a couple projects that can deliver XML suitable for this Nagios plugin. A netduino temperature sensor can be found on gitHub as HomeAmationNetDuino and my Parallax Propeller project NerdDoro source is available on github as nerdDoro it produces similar XML in Propeller .spin.
Given an XML file in this format my python Nagios plugin can be configure for normal, warning and alert states.
With this python script I create temperature data for input to Nagios. Here’s a gist at gitHub for it check_temperature_wo
#!/bin/env python
'''
Created on Jan 21, 2012

@author: jeffa aka @jhalbrecht
'''

# jha 8/17/2013
# Prepare code for publishing.

# jha 1/21/2012
# http://www.ibm.com/developerworks/aix/library/au-nagios/#iratings
# http://www.gefoo.org/generalfoo/?p=201

import sys
import getopt
import urllib2
from xml.dom.minidom import parseString

nagios_codes = {'OK': 0, 'WARNING': 1, 'CRITICAL': 2, 'UNKNOWN': 3, 'DEPENDENT': 4}

def nagios_return(code, response):
    # Prints the response message and exits the script with
    # one of the defined exit codes.
    print code + ': ' + response
    sys.exit(nagios_codes[code])

def usage():
    print """Usage: check_temperature [-h|--help] [-w|--warning level] [-c|--critical level]
    Warning level defaults to 85.0
    Critical level defaults to 95.0"""
    sys.exit(3)

def main():

    try:
        options, args = getopt.getopt(sys.argv[1:],
            "h:w:c:",
            "--help --warning= --critical=",)
    except getopt.GetoptError:
        usage()
        sys.exit(3)

    Warning = 85.0 ; Critical = 95.0

    for name, value in options:

        if name in ("-h", "--help"):
            usage()

        if name in ("-w", "--warning"):
            try:
                Warning = 0.0 + float(value)
            except Exception:
                nagios_return('UNKNOWN','Unable to convert to floating point value')

        if name in ("-c", "--critical"):
            try:
                Critical = 0.0 + float(value)
            except Exception:
                nagios_return('UNKNOWN','Unable to convert to floating point value')

    # download the file
    try:
        # jha 8/17/2013 Align with HomeAmation expectations
        # MODIFY HERE
        # with url to your temperature XML FQDN or ip address
        file = urllib2.urlopen("http://x.y.z.h/PutYourUrlHere")
    except Exception:
        nagios_return('UNKNOWN','urlopen failed')

    #convert to string:
    data = file.read()
    #close file because we dont need it anymore:
    file.close()
    #parse the xml you downloaded
    dom = parseString(data)
    #retrieve the first xml tag (data) that the parser finds with name tagName:
    xmlTag = dom.getElementsByTagName('CurrentTemperature0')[0].toxml()
    #strip off the tag (data  --->   data):
    xmlData=xmlTag.replace('','').replace('','')

    # Checking for excessive heat. Could enhance to check for excessive cold
    if float(xmlData) >= Critical:
        nagios_return('CRITICAL','Temperature: %.2f  fahrenheit' % float(xmlData))

    elif float(xmlData) >= Warning:
#        nagios_return('WARNING','Temperature: ' + xmlData + ' fahrenheit')
# bingled a nice format string
        nagios_return('WARNING','Temperature: %.2f  fahrenheit' % float(xmlData))

    else:
        nagios_return('OK','Temperature: %.2f  fahrenheit' % float(xmlData))

if __name__ == '__main__':
    main()
Define the Nagios command
define command{
        command_name    check_temperature_wo
        command_line    $USER1$/check_temperature_wo -w $ARG1$ -c $ARG2$
}
And the Nagios Service. Note the warning and alert settings of 79 and 85. My nagios plugins are located on my ‘localhost’ host.
define service{
        use                             local-service         ; Name of service template to use
        host_name                       localhost
        service_description             Temperature_wo
        check_command                   check_temperature_wo!79!85
        notifications_enabled           0
        }
That’s it. Plug them in to your Nagios system. Remember to change the url for your XML temperature source.
Enjoy!